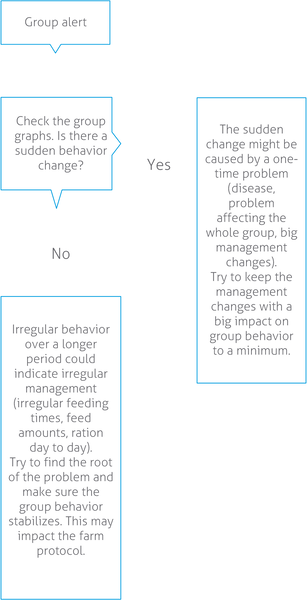
Check the herd performance trend
The system monitors the group performance and shows it in a graph on your dashboard. The herd performance graph shows trends and insights on the behavior of groups or your entire dairy herd. It visualizes how external factors and your management strategies influence the behavior of your groups and herd, such as the impact of housing conditions, feeding strategies and milking procedures on your herds performance.
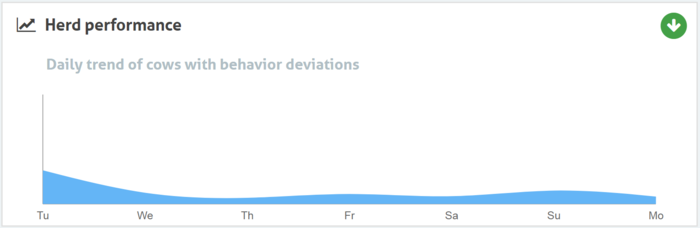
The graph shows how many animals of the complete herd (in %) show unusual behavior. All animals with unusual behavior are included, even when they do not have a health attention yet. The performance trend is indicated by an icon in the upper right corner.
Use the herd performance trend to respond to behavior changes and make improvements in your farm management. Aim for as much stability in cow behavior as possible, since stability and regularity are important contributions to the success of a dairy farm. Cows are creatures of habit and perform at their best if every day follows the same format. Any type of change in a cows daily routine causes stress, and stress has a negative effect on milk production, reproduction and health of dairy cows.
The graph should be as flat as possible, and indicate as less behavior deviations as possible. See the picture below for an example of a farm with a stable and good herd performance, with less behavior deviations.
 |